Buteyko Breathing Charts
Buteyko Breathing Charts (Diagrams used in the 1964 manual)
Volume 1 Doctor Buteyko’s Discovery Trilogy by Sergey Altukhov English translation 2009 eBook
The Buteyko Breathing Charts & Text are taken from: Doctor Buteyko’s Discovery Volume 1 The Destruction of the Laboratory by Sergey Altukhov and was published in 1990
Sergey Altukhov was commissioned by Professor K.P. Buteyko on June 1988 to write the truth about his method.
Professor K.P. Buteyko approved the first volume in March 1990.
The text below has been taken from the Doctor Buteyko’s Discovery Volume 1 2009 English translation ebook which was translated from the more detailed Two-Volume Edition published in 1993.
The content of this written work is fact and is written in the style of a documentary novel, the names and places have been changed.
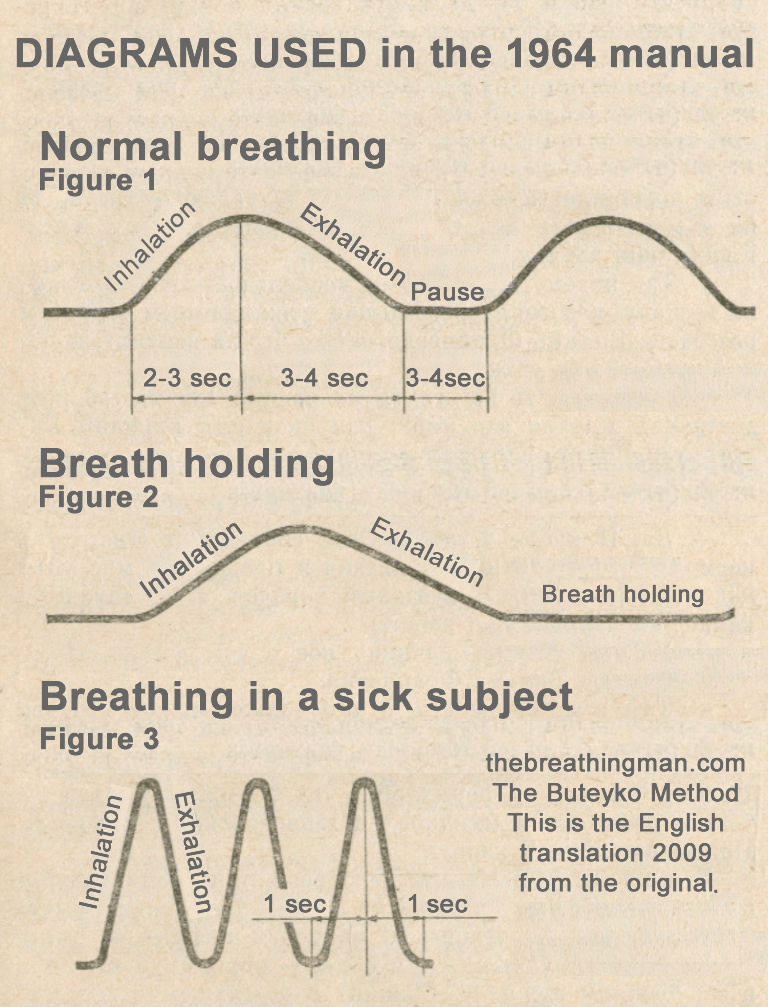
Buteyko Breathing Chart: Normal breathing, Diagrams used in the 1964 manual
Normal breathing: Figure 1: showing 2-3 second inbreath, 3-4 second outbreath & 3-4 second pause.
Breath hold: Figure 2: showing inbreath, outbreath & pause. (All Buteyko breath holds are after the outbreath)
Breathing in sick subject: Figure 3: showing 1 second inbreath & 1 second outbreath.
Buteyko Breathing Chart: Normal breathing, Diagram used in the 1964 manual
Important information (in bold text below paragraphs five, six & ten)
Excerpt from Volume 1 Chapter 17: The First Handbook
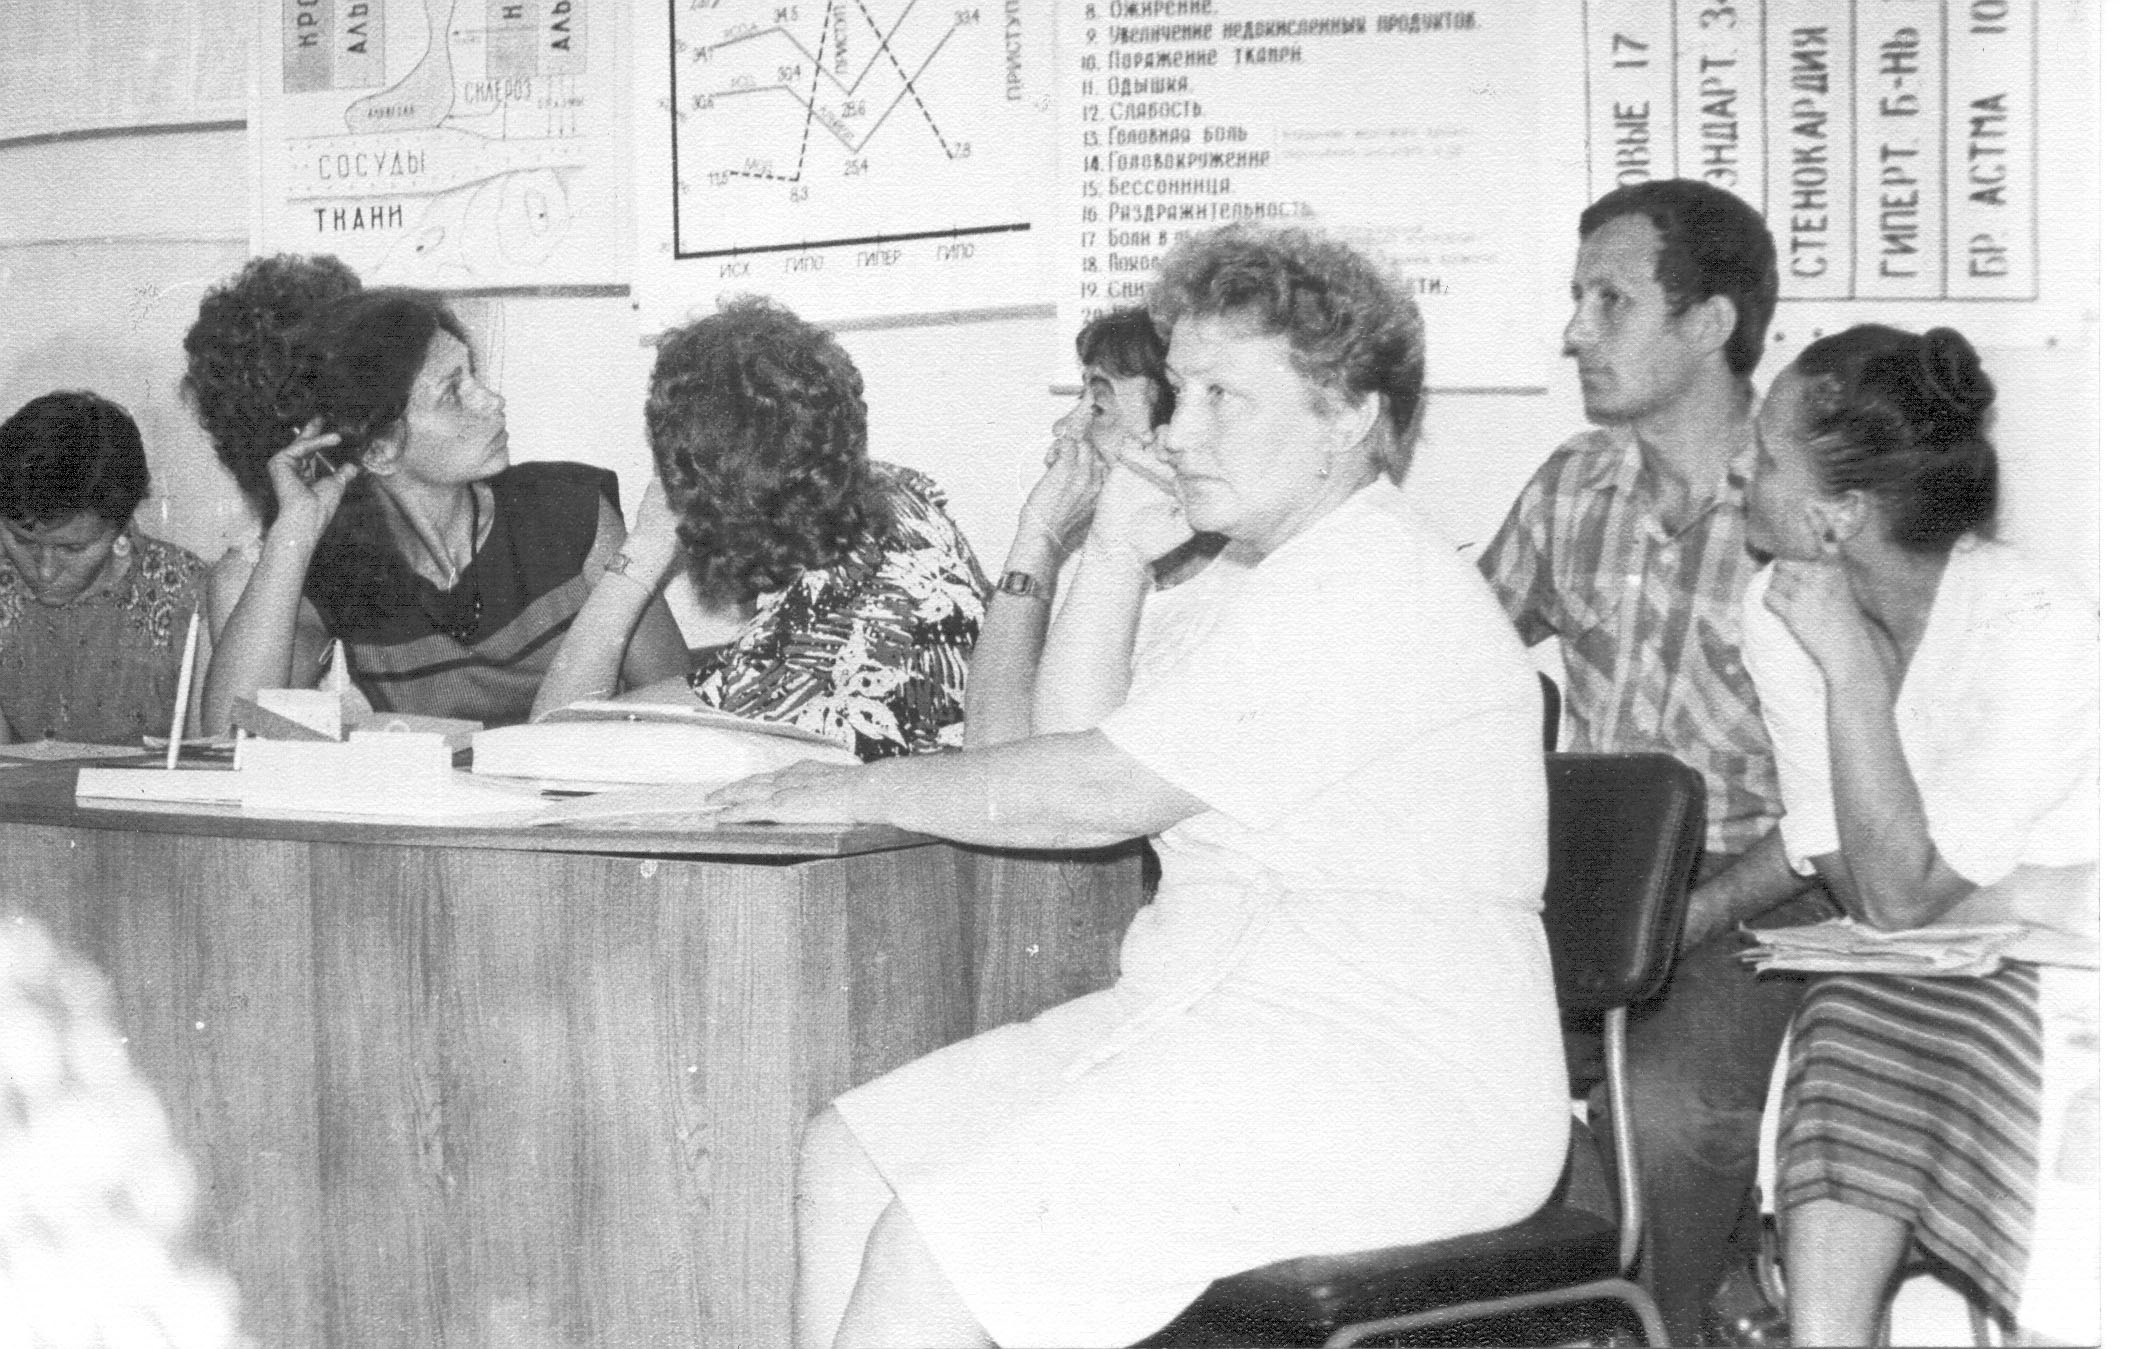
She continued reading the familiar text: ‘With the cooperation of other Institutes of the USSR Academy of Sciences (Siberian section), the Laboratory of Functional Diagnostics (Director K. P. Buteyko, PhD (medical sciences)) of the Institute of Cytology and Genetics has discovered one of the primary direct causes leading to the emergence and development of the conditions indicated. The cause in question is a breathing dysfunction which takes the form of chronic hyperventilation of the lungs (an abnormal deepening and increase in rate of breathing whether the subject is at rest or in motion)…’ She was pleased to note that the word ‘hyperventilation’ stood out in bold type.
‘… A reduction in the concentration of carbon dioxide in the body, the narrowing of blood vessels and the strong bonding of oxygen with the blood reduces the flow of oxygen to the cells of the heart, brain and other organs, damages the bronchial tubes and blood vessels, stimulates the nervous system, adversely affects sleep, and gives rise to shortness of breath, headaches, tinnitus, angina attacks, disorder of the metabolism, weight gain, raised blood cholesterol level, a rise or fall in arterial pressure, biliary dyskinesia, constipation and other bodily disturbances …’ Kolya the lab assistant had begun reading the text aloud, but was now told by the others to pipe down.
‘… Normalisation of breathing immediately triggers a healing process which ultimately eliminates a whole range of the symptoms indicated,’ read Natalya, the sentence jumping out at her. At the foot of the second page, the handbook stated that normalisation of breathing offers virtually complete protection against heart attack, stroke, progressive sclerosis of the vessels and emphysema. And a little further on, there appeared the first of three diagrams included in the handbook. It was headed ‘Normal Breathing’ and was the Lab staff’s attempt at illustrating a healthy person’s pattern of breathing. The ideal to strive for. An undulating line with horizontal sections between the peaks showed that in a really healthy person, an inhalation lasts two to three seconds. The exhalation lasts a second longer. The automatic pause before the next inhalation generally corresponds to the length of the exhalation.
Laying the handbook aside for a moment, Natalya recalled the heated debates which had developed when the diagram was being worked on. Most of the staff thought it was vital to include a diagram of this sort. “If we’re asking people to breathe normally, then we need to give them a benchmark,” an agitated Dr Bubentsova had insisted. In the end, Buteyko had gone along with them, but he still voiced one doubt. He was completely behind the idea of including a benchmark for health, but was seriously concerned that patients might misinterpret it.
“Of course they should know about it,” he said cautiously, “But I’m worried they may be so eager to count the seconds that they lose sight of the main object – reducing depth of breathing by means of relaxation.”
Subsequent history proved him right. On numerous occasions they had to discourage people from putting too much emphasis on counting seconds for the inhalation and exhalation. But you won’t get very far in any science – least of all in medicine – without trial and error. It was a stage they had to go through.
At first, the lines ‘the patient must have a sound knowledge of what normal breathing should be like, and be able to measure their breathing rate and determine the length of time the breath is held …’ had seemed entirely uncontroversial. There followed a detailed explanation that each breath consists of an inhalation, an exhalation and a pause (as illustrated in Figure1). Breathing exclusively through the nose was advocated, whether the subject was at rest or undertaking gentle physical activity. A detailed breakdown was given. First, a slow inhalation lasting 2-3 seconds and as shallow as possible (0.3-0.5 litres, almost imperceptible to an observer). This to be followed by a calm, passive, complete exhalation lasting 3-4 seconds. Then a pause (!) of 3-4 seconds, a further inhalation, and so on.
It was brought to the attention of the uninitiated reader that a healthy person’s rate of breathing is 6-8 times per minute. Under these conditions, ventilation of the lungs does not exceed the required norm of 2-4 litres a minute, thus providing the six and a half percent CO2 content within the pulmonary alveoli which is so vital for the body.
It seemed as if everything in this portion of the text had been tweaked to perfection, but subsequent experience showed that, while a patient must of course know how to count his own breathing rate per minute, on no account should he often resort to such counting – far less at every moment of his practice!
Experiments revealed that if a patient concentrated his attention on actually keeping count of his frequency of breathing the result was even greater overbreathing. And that results not in a reduction in breathing rate per minute, but in an increase!
But of course all these methodological amendments came later, with the benefit of experience. For the moment, in the run-up to the May holiday, the Laboratory was proudly celebrating a great achievement: its first legally published handbook.
The staff were still animatedly swapping reactions to particular passages, and in the corridor patients were already discussing how they could get their hands on one of the precious copies.
Natalya read through the section entitled ‘How to correct (or normalise) breathing’ twice. After all, it was no time at all since Konstantin Pavlovich’s assistants had helped him polish the final version so painstakingly! ‘…
Buteyko breathing chart: Alveolar CO2 in MMHG

This chart shows the partial pressure of carbon dioxide in the pulmonary alveoli. This measure is given for each disease in millimetres of mercury.
Chart explained in bold text below, paragraphs five, seven, ten, thirteen and fourteen.
Excerpt from Volume 1 Chapter 26: Professor Chugunov Harrumphs. The patient demonstration at the research conference. Pauses and illnesses. Can you lose weight from overbreathing? The preliminary trial is a success but the head doctor is sacked.…
Her statement excited a great deal of interest among the audience.
After this, one patient after another mounted the stage. For each one, the clinic doctors who had attended Natalya’s course with the groups gave an introduction. During their presentations the patients responded to a wide range of questions from the floor. How many years had they been ill? Had their attacks stopped a long time ago? Weren’t they worried that their afflictions would recur?
“I wonder if I might ask a question?” A rather thin surgeon in horn-rimmed spectacles raised his hand from the fourth row. “We have seen evidence today of your undoubted success, with examples provided by all your patients. They have been able to rid themselves of their asthma attacks. Many of them have also managed to normalise their blood pressure, ameliorate angina etc.” The surgeon nodded in the direction of the front row. “Yet the means of achieving all these things was always the same – they stopped breathing deeply. I wonder if you could explain the process involved in a little more detail for us. For example, how long must the control pause you mentioned in your presentation be, in order to guarantee relief from a particular disease?” The surgeon looked penetratingly at Natalya, as though seeking to lure her into piling a great heap of disparate, haphazard facts on their heads…
“I understand your question.” Natalya went over to the stand with the posters. She removed the top one illustrating respiratory metabolism in the human body and revealed underneath it a bar chart with five bars.
“This chart shows the partial pressure of carbon dioxide in the pulmonary alveoli,” she explained unhurriedly, with emphasis. “It’s a very interesting chart,” her audience had become unusually quiet, “although I hadn’t planned to spend much time on it today.
”Natalya gestured the surgeon to sit down. “We are currently talking about the clinical trial conducted to assess the effect of the Method on asthma sufferers and that’s what the official report will focus on. However, since you have touched on this issue I am not going to avoid it.
“This poster illustrates our experimental data, which enable us to calculate, for example, what length of control pause is necessary generally speaking to relieve the patient of very common, serious diseases such as bronchial asthma, hypertension, angina and obliterating endarteritis.”
She paused for a moment. The doctors had grown serious and couldn’t tear their eyes away from the mysterious chart…
“I have spent some time here explaining that the Method does not bring temporary relief, it is a lifelong weapon in the fight against illness. I said that only once a patient has achieved a control pause of 60 seconds is he or she insured against illness.” Natalya picked up the wooden pointer which leant against the poster stand.
“What I’ve said may sound convincing but it’s still only words. This chart, however, is a different matter.” Natalya tapped the poster which had attracted such universal, rapt attention. “Another aspect of Dr Buteyko’s great Discovery is that he does not base his work purely on a verbal exposition of his principles. He has also undertaken very precise mathematical analysis. Figures, figures and more figures – that’s his creed!
“We have just one task here today – to validate treatment using the Method, but only in relation to asthma.” She put down the pointer and straightened a couple of the posters which had slipped. “However, this does not mean that the Volitional Elimination of Deep Breathing is only capable of relieving this one condition.
“Indeed, Dr Buteyko himself initially cured his own malignant hypertension with the aid of the Volitional Elimination of Deep Breathing.” Natalya saw the surgeon who had originally asked her this tricky question almost leap of his seat in agitation at her words.
“Naturally,” she again passed the pointer across the chart, “at our Laboratory we have conducted and continue to conduct research into the effectiveness of the Method in relation to other diseases linked to a CO2 deficiency in the body. The five bars in this chart bear out far more eloquently than words the fact that you can only become completely healthy, by achieving a control pause of one minute without the risk of getting rid of one disease only to develop another.” Natalya looked defiantly at the surgeon, who had barely regained his composure.
“Of course, I am exaggerating slightly. The chart doesn’t show the control pauses for each of the five conditions. You can see from the heading that it deals with partial pressure of carbon dioxide in the lungs. This measure is given for each disease in millimetres of mercury and is shown above the relevant bar on the chart. This is, of course, much more accurate than patients empirically measuring their own control pauses. Instruments are instruments. Nevertheless, in answer to the question, I would say that, if we look at the table showingpulmonary ventilation criterianext to the chart (she moved the pointer across the seven stages leading to death depicted on the table), it is possible to convert millimetres of mercury to a measurement that approximately corresponds to the control pause.
“Then,” Natalya took a piece of chalk and made some simple calculations on a small blackboard, “we end up with a scenario where on average we can get rid of bronchial asthma by increasing the control pause to 25 seconds. I would emphasise, however, that this is an average! It’s very approximate. A significant role is played by the age of the patient and the severity of their condition. Also, please note that 25 seconds is definitely the control pause and certainly not the maximum pause .”
Buteyko Breathing Chart: Pulmonary Ventilation Criteria

Correlation of control pause and other parameters with alveolar CO2 and patient health (Chart explained in bold text below, paragraphs five, six & seven)
Excerpt from Volume 1 Chapter 9: Adler. Batumi. Reflections on the beach.
The Doctor spent the day zig-zagging between the restaurant veranda and the small beach. He managed to slightly calm his frayed nerves by sipping the local wine. When he lay on a recliner to sun himself a little, his head began to spin pleasantly.
It was 29 August… the sixth day of his journey, with only three remaining until his defence. He closed his eyes and lay back on the salt-weathered boards of the wooden recliner. August was almost over. He didn’t yet know what this autumn would bring, but it was at this time two years ago that he became completely estranged from Professor Pomekhin.
On 11 November two years ago, Buteyko had presented his Discovery to the Scientific Council of the Siberian Branch of the Soviet Academy of Sciences. Unlike some other such presentations, it was based on more than the over-excitement of the pioneering scientist. Buteyko had seven years of hard work behind him (starting from October 1952), which he had spent gathering proof. He had cured hundreds of patients from asthma, hypertension and angina, and he had created his combine-complexator, which could give a mathematically accurate picture of a patient’s health. Buteyko completed his work on the complexator in Novosibirsk, but he had gathered much of his data in Moscow at the beginning of the 1950s, in his laboratory in Academician Dariev’s department. It was at this time that he had developed the most important components of the complexator.
Buteyko propped himself up on his elbows and looked in the direction of the restaurant veranda. No-one was looking for him yet. He rested his head in the crook of his right arm and mentally returned to November 1960.
How curiously his colleagues had looked at the tables that he hung on the board! They paid especial attention to one where the seventh row down was marked ‘death’ – no-one wants to die.
“‘Physiological Condition of the Body and Pulmonary Ventilation Criteria according to Dr K Buteyko’.” Professor Pomekhin read the heading aloud in a monotone before returning to the chairman’s seat.
“This table allows us to monitor the seven stages in a patient’s progression towards death or to the longest possible healthy longevity, in other words,” here Buteyko gave an embarrassed smile, “by our current modest standards, to virtual immortality.
”Someone in the audience started sniggering and there was muttering at the back. Shikhman, former Head of the Physiological Laboratory, was sitting there.
“I see that some of you don’t believe me when I say that carbon dioxide deficiency is the fundamental cause of many common diseases.” Buteyko was trying to disregard Shikhman’s rudeness, which was, moreover, obviously supported by the chairman. “Let’s take a look at the role of carbon dioxide from a historical biological point of view.”
Buteyko could feel himself becoming tense, and his piercing gaze made Shikhman fall silent…
Buteyko Breathing Chart: Equations Linking Respiratory Parameters
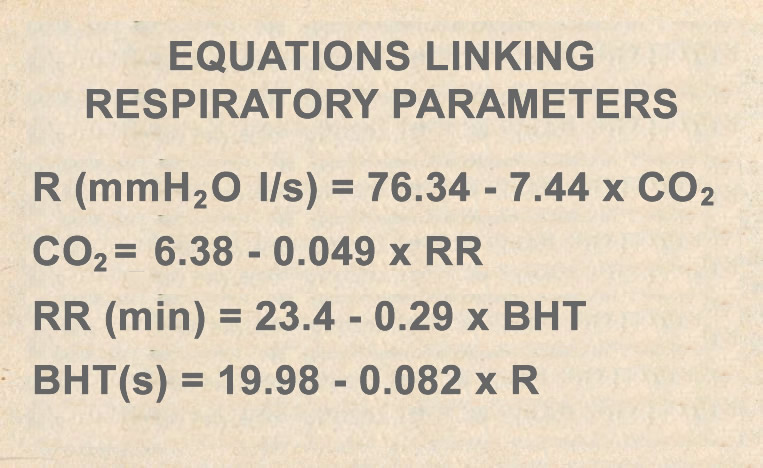
Excerpt from Volume 1 Chapter 31: The magic formulae of Buteyko’s Equations Linking Respiratory Parameters. The method is STOLEN. Storm clouds gather
this resistance will be around 31.7 millimetres of water. In a patient with a reduced level of CO2, it will be higher, in exact proportion to the extent that the patient’s body has been damaged by deep breathing.
“It’s very simple as you can see, but neither doctors nor patients know about these formulae. Often the stage of progression of a disease is unclear, and yet here it is, expressed by an exact mathematical formula.
“So what can I do? In order to avoid my current problems and persecution, I would have to hide these and similar formulae in the comfortable prison of Star City.” The Doctor’s eyes blazed. “No, and again no, even if my difficulties were multiplied by a thousand. Even if I end up on the gibbet or in the madhouse. These formulae will remain accessible to anyone who needs them. Pilots and sailors can find out about them on an equal footing with everyone else. Any scientist who can kit out a laboratory like ours can provide a completely accurate diagnosis. Any patient who knows of their existence can request such a diagnosis from doctors and doesn’t need to put up with, for example, a bronchoscopy that produces such inaccurate results but causes such unbearable suffering to the patient.
“These formulae were my achievement.” The Doctor smoothed his untidy hair. “Yes, we’re poor and oppressed, but our formulae and blueprints can be displayed at any conference. People take photos or write them, or else learn them by heart. You could say they’re alive.” Buteyko affectionately stroked the poster. “People throughout the country are learning about them. Foreign journalists attending medical conferences in Moscow jot them down. They’re being printed in foreign journals, and hopefully one day, the whole world will be talking about them!” The Doctor raised his head in pride. “Science, particularly medicine, must be international. People fall sick all over the world. Can we really afford to be isolationist?”
“And what do the other three formulae mean?” questioned Dr Goncharova, ever the keen scientist.“Which ones?” asked Buteyko, somewhat taken aback by her unexpected interruption while he was in full flow.“Those ones.” She read aloud the remaining three formulae.
“Well, you already know what CO2 is,” said Buteyko with a smile. “RR means the respiratory rate per minute. And the BHT is the breath holding time in seconds. The four formulae connect the parameters of respiration.”
Wilma immersed herself in the vast ocean of Buteyko’s discoveries during her first weeks in his Laboratory . It was all so fascinating that she had no wish to return to mundanity. However, she was soon forced to when it turned out that people came to Buteyko’s Laboratory not only to acquire experience – they also came to steal…
Buteyko Breathing Chart: The Bodies Protective Mechanisms
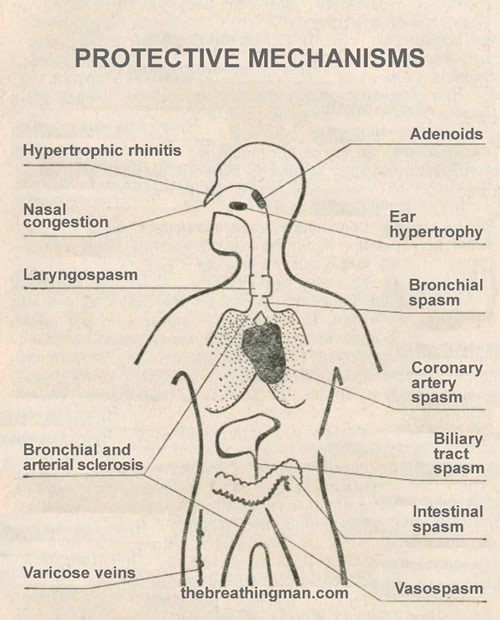
The Bodies Protective Mechanisms:Hypertrophic rhinitis
Nasal congestion
Laryngospasm
Bronchial and arterial sclerosis
Varicose veins
Adenoids
Ear hypertrophy
Bronchial spasm
Coronary artery spasm
Biliary tract spasm
Intestinal spasm
Vasospasm
Buteyko Breathing Chart: Respiration
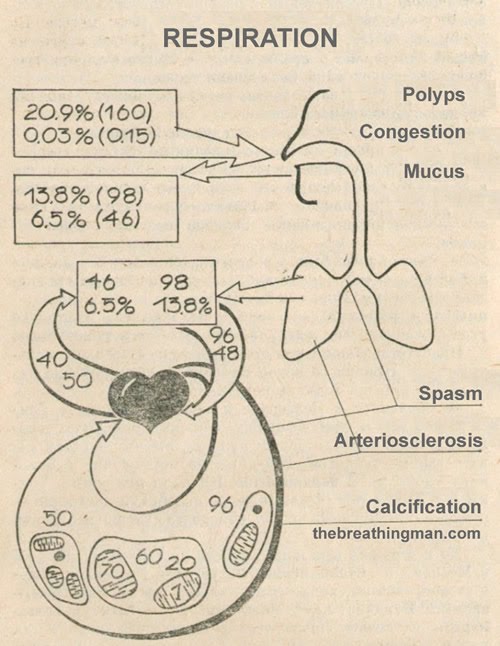
Respiration
Buteyko Breathing Chart: Evolution of the Atmosphere, Respiration in the Human Fetus
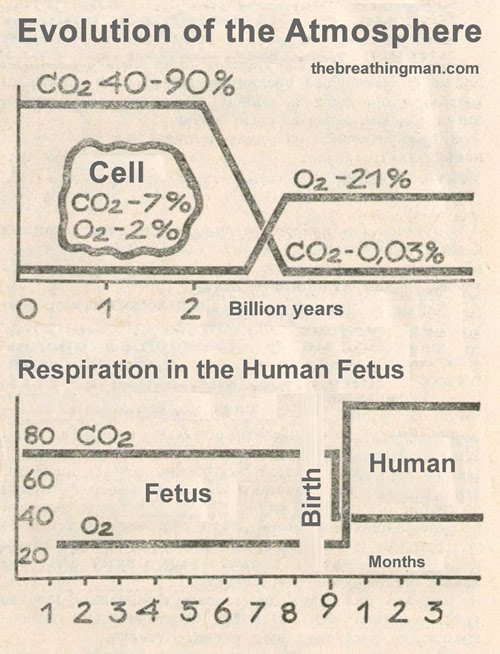
Chart: Evolution of the Atmosphere, Respiration in the Human Fetus
Buteyko Breathing Chart: The Effects of Hyperventilation

The Effects of Hyperventilation
1. Decrease in СO2 in the alveoli and the blood
2. Increased metabolism and metabolic disorders
3. Bronchial constriction
4. Constriction of the blood vessels and other smooth muscle
5. Increased or decreased arterial pressure
6. Tighter bonding of oxygen to the haemoglobin in the blood
7. Increased blood cholesterol
8. Obesity
9. Increased partially oxidised metabolic products
10. Тissue damage
11. Breathlessness
12. Weakness
13. Headache (Impaired blood circulation in the brain, stroke and so on)
14. Dizziness (Impaired blood circulation in the brain, stroke and so on)
15. Insomnia
16. Irritability
17. Heart pain. / angina pectoris, myocardial infarction
18. Feelings of cold in the extremities. / intermittent lameness
19. Decreased efficiency at work
20. Noise in the ears
Buteyko Breathing Chart: Asthma Attack
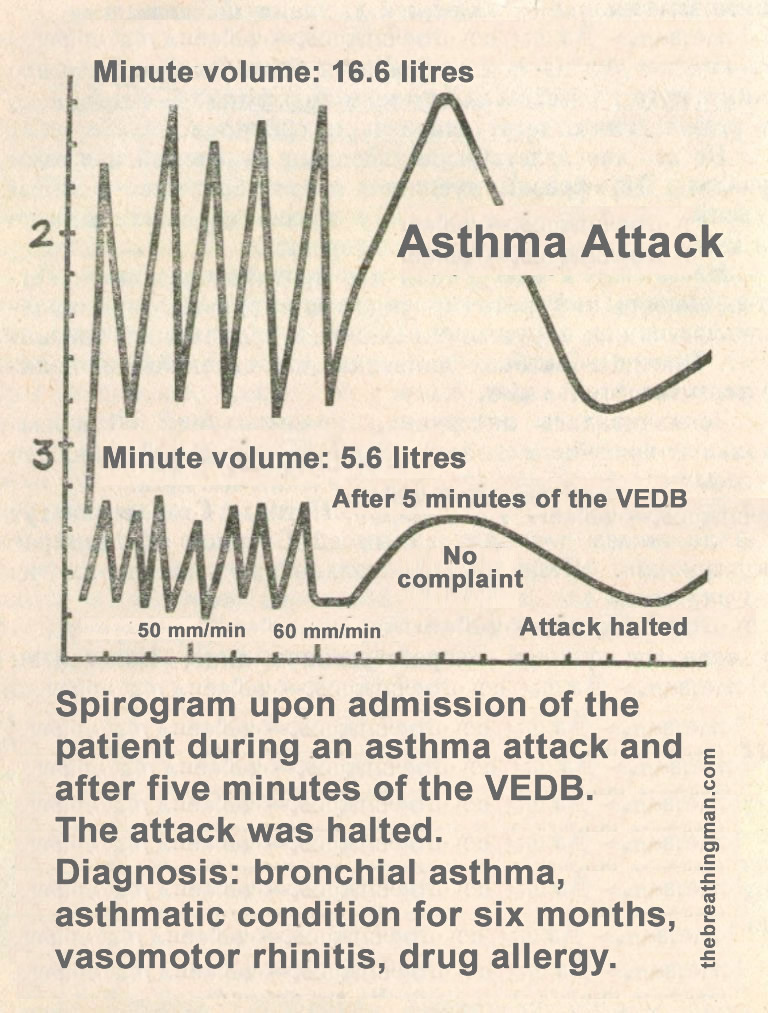
Asthma Attack halted in 5 minutes of applying the VEDB method (VEDB method – Volitional Elimination of Deep Breathing) Asthma Attack Chart
Spirogram upon admission of the patient during an asthma attack and after five minutes of the VEDB (VEDB method – Volitional Elimination of Deep Breathing). The attack was halted. Diagnosis: bronchial asthma, asthmatic condition for six months, vasomotor rhinitis, drug allergy. Author: Sergey Altukhov Thank you to Sergey Altukhov for giving permmision to use the excerpts from his volume 1.
Doctor Buteyko’s Discovery, Russian to English Translation 2009:
Translators: Text: Volume 1 Chapter 17, Denise Steele, Volume 1 Chapter 26, Heather Stacey Volume 1 Chapter 9 & 31 Fiona Paterson MA Charts: Fiona Paterson MA
